Introduction
Imagine this common scenario: it’s 2 AM, and your pager screams. A critical service is down. You scramble, groggily logging into dashboards, sifting through an avalanche of logs, and trying to correlate disparate metrics. Your heart pounds as you race against the clock, performing incident archeology while users experience downtime. This reactive firefighting, while a rite of passage for many engineers, is an exhausting and unsustainable model in today’s complex, distributed systems.
Modern software demands more than just reacting to failures. The sheer velocity and volume of telemetry data from microservices, serverless functions, and ephemeral containers make traditional manual analysis an uphill battle. Relying solely on static thresholds and human interpretation means you are always a step behind, waiting for an issue to manifest before you can address it.
The good news is that a new paradigm is emerging. Artificial intelligence is not just a buzzword here; it’s fundamentally reshaping how we approach system health. In this post, you’ll learn how AI is transforming observability from a rearview mirror into a crystal ball, empowering you to predict and prevent problems rather than just responding to them.
The Problem Worth Solving
Your applications and infrastructure are more complex than ever before. You’re likely managing dozens, if not hundreds, of services interacting across multiple clouds, on-premises environments, and various data stores. Each component generates its own stream of metrics, logs, and traces. The aggregated data often represents terabytes of information daily. This incredible volume, while rich in potential insights, also creates an overwhelming noise floor.
Traditional observability tools, while foundational, often struggle to keep pace with this complexity. Setting static thresholds for CPU usage or error rates becomes an exercise in futility when application behavior is dynamic and workload patterns shift constantly. What constitutes an “anomaly” on a Monday morning might be perfectly normal on a Saturday afternoon. Your monitoring might trigger false positives, leading to alert fatigue, or worse, false negatives, allowing critical issues to go unnoticed until they impact your users.
The core challenge is that traditional observability is inherently reactive. You collect data, visualize it on dashboards, and set alerts based on predefined conditions. This approach is excellent for understanding what happened after the fact. However, it leaves you vulnerable to unforeseen interactions, subtle performance degradations, and emerging patterns that only become obvious once they’ve already escalated into a full-blown incident. The cost of this reactivity, in terms of lost revenue, damaged reputation, and engineer burnout, is simply too high for modern enterprises. You need to move beyond simply observing; you need to understand, predict, and ultimately, prevent.
From Retrospection to Foresight: The AI-Powered Observability Paradigm
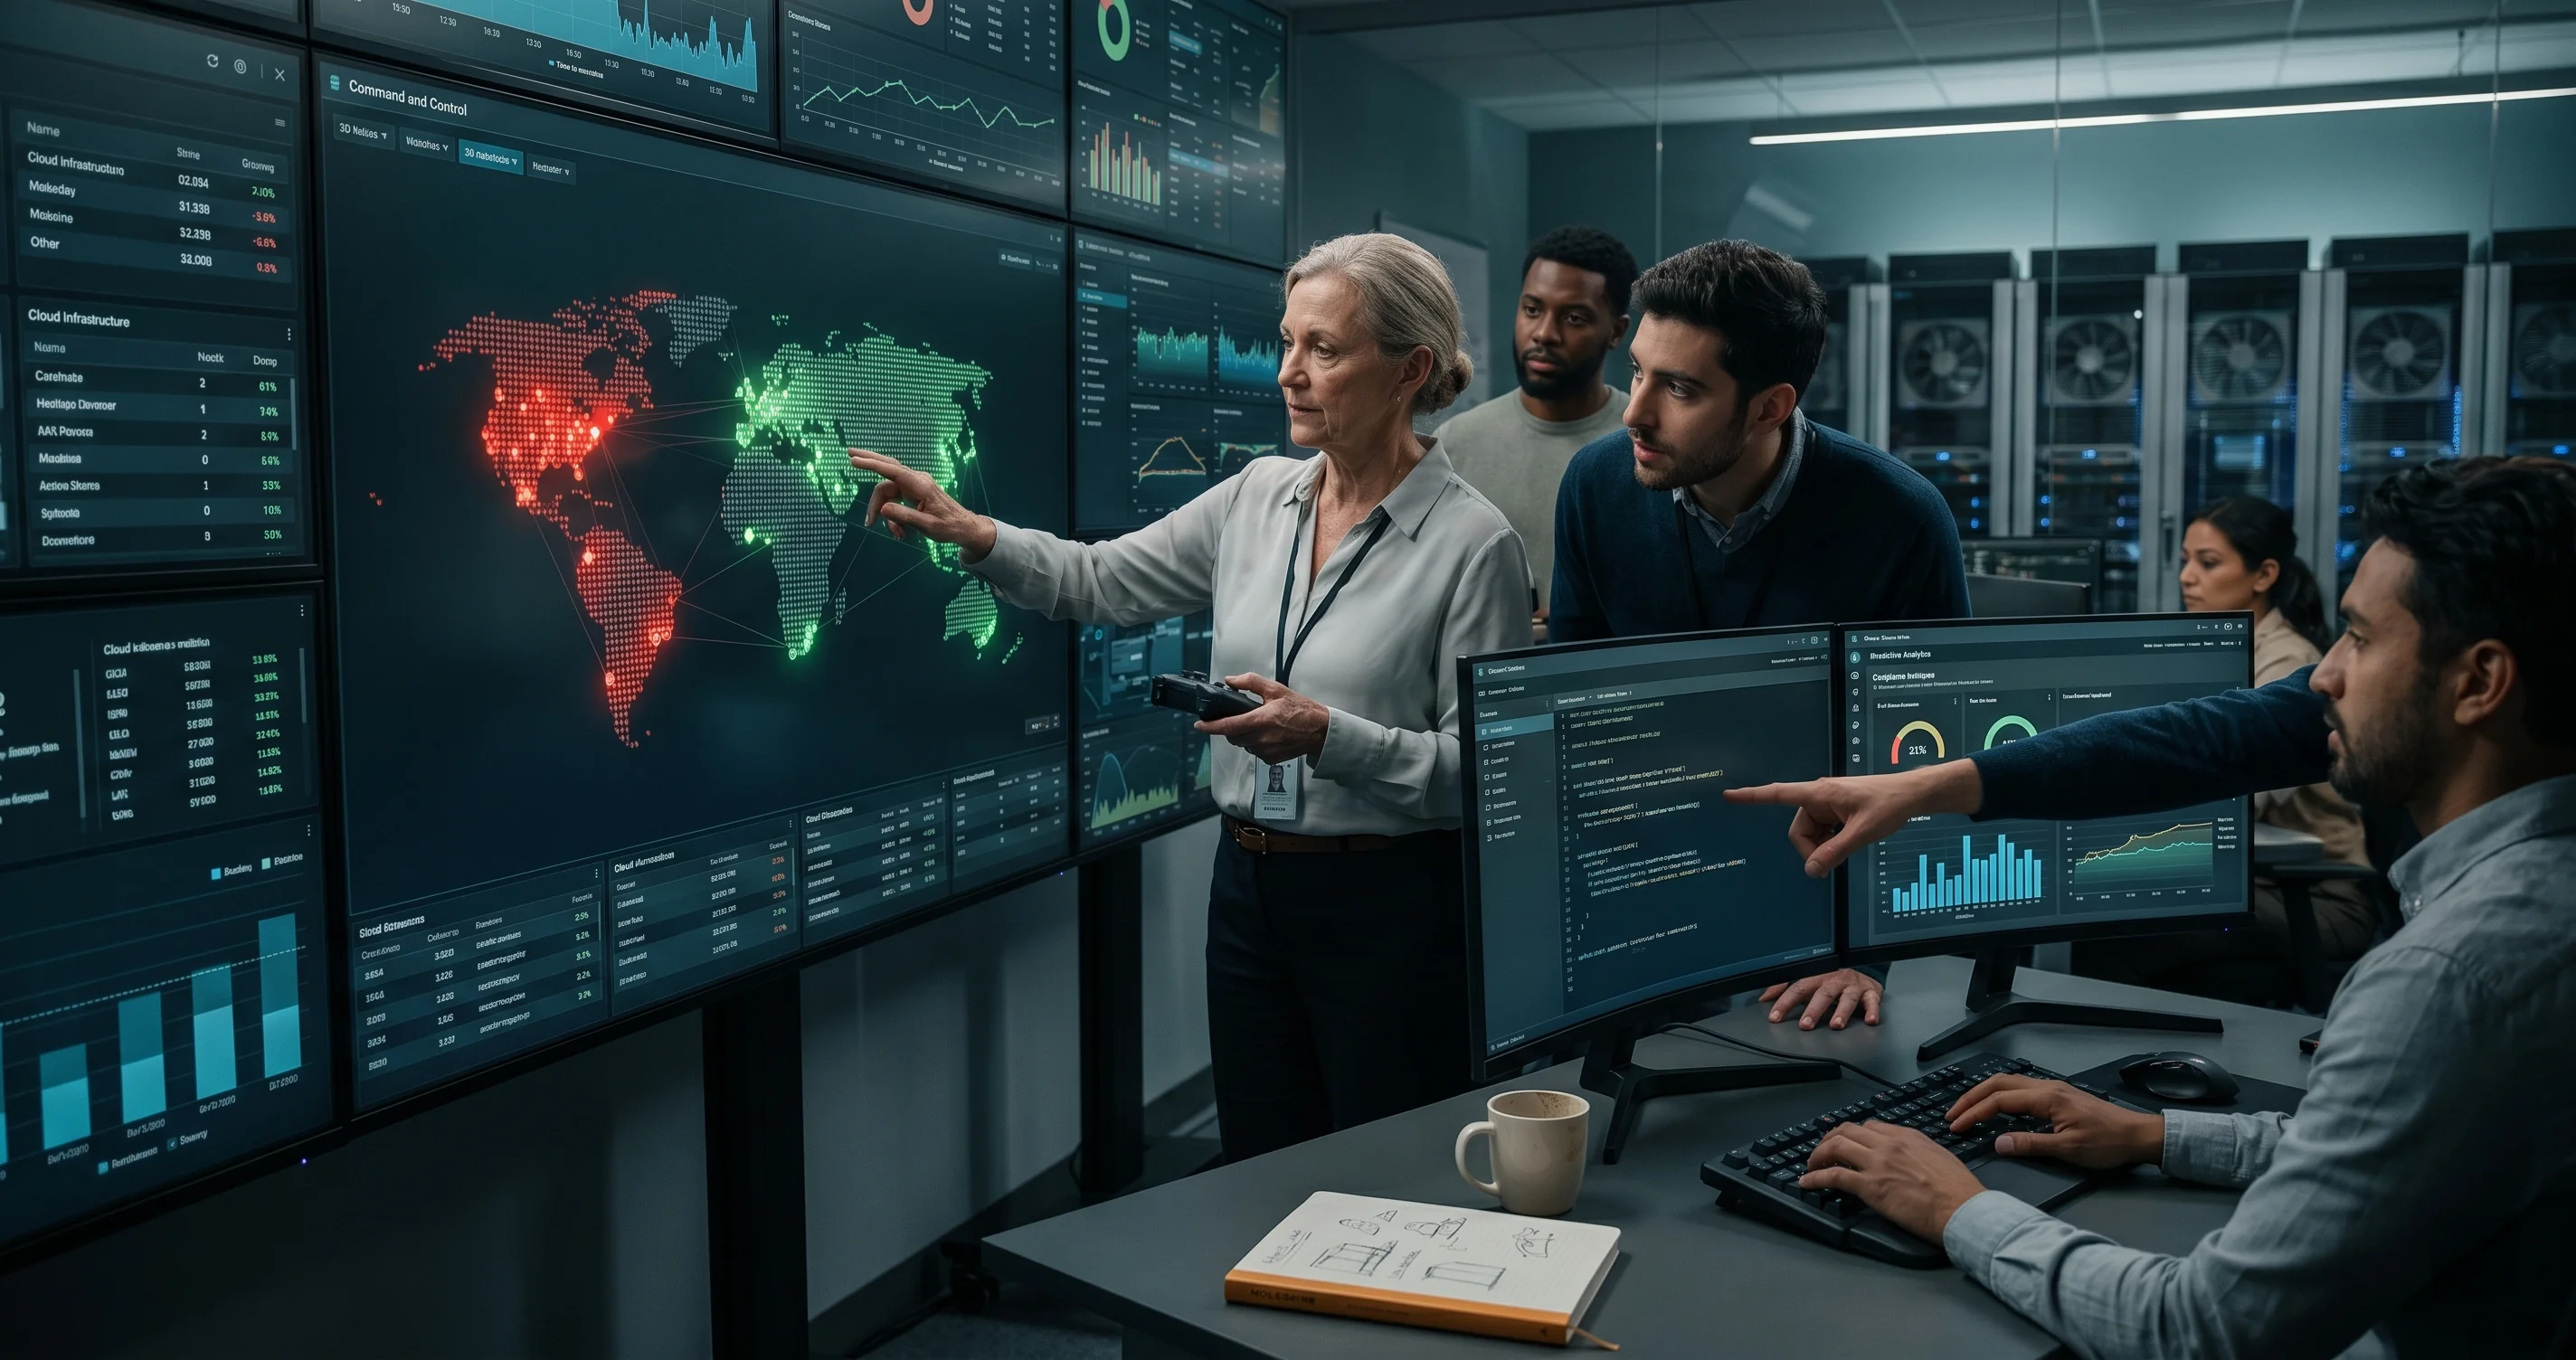
This is where AI-powered observability steps in, flipping the reactive model on its head. Instead of merely collecting and displaying data, AI/ML models actively process your telemetry to uncover hidden patterns, predict future behavior, and even suggest root causes before you begin troubleshooting. It’s about empowering your systems with a form of self-intelligence.
At its core, AI-driven observability leverages sophisticated algorithms to ingest and analyze vast streams of metrics, logs, and traces. Unlike static thresholds, these models learn the normal operational behavior of your systems over time, understanding context like time of day, day of week, and deployment cycles. This dynamic baseline allows for far more accurate intelligent anomaly detection. Instead of flagging every spike above a fixed line, the AI identifies true deviations from learned patterns, drastically reducing alert noise and focusing your attention on genuine threats.
Beyond merely spotting anomalies, AI also enables predictive analytics. By analyzing historical data and current trends, machine learning models can forecast potential issues before they materialize. Imagine being alerted that a specific database’s connection pool is likely to exhaust its capacity in the next 30 minutes, giving you ample time to scale up or optimize, rather than discovering it only after the application fails. This foresight is a game-changer, transforming incident response into proactive incident prevention.
Finally, AI significantly enhances automated root cause analysis. In a distributed system, an issue in one service can ripple through many others, creating a complex web of correlated events. Manually tracing these dependencies and pinpointing the true origin of a problem is incredibly time-consuming. AI algorithms can analyze logs, traces, and metrics across your entire stack, automatically correlating events and identifying the most probable root causes. This doesn’t just speed up resolution; it provides context that even the most seasoned human engineer might miss amidst the chaos of a live incident. You move from “what happened and where did it break?” to “this is likely the culprit, and here’s why.”
How to Apply Predictive Monitoring in Your DevOps Workflow
Integrating AI-powered observability into your workflow requires a thoughtful approach, focusing on data quality, model training, and continuous refinement. Here’s how you can begin to apply these concepts to transform your system monitoring.
Step 1: Consolidate Your Telemetry Data
Before AI can work its magic, you need a unified and comprehensive data pipeline. Your metrics, logs, and traces must flow into a central observability platform. Without this consolidated view, AI models will operate on incomplete information, leading to suboptimal insights.
Start by ensuring your agents and exporters (e.g., Prometheus Node Exporter, Fluentd, OpenTelemetry agents) are properly configured across all your services and infrastructure components. Use consistent tagging and metadata to enrich your telemetry, making it easier for AI to correlate events across different layers.
# Example: Basic OpenTelemetry Collector configuration snippet
receivers:
  otlp:
    protocols:
      grpc:
      http:
  hostmetrics:
    collection_interval: 1m
    scrapers:
      cpu:
      memory:
      disk:
      filesystem:
      network:
processors:
  batch:
  resource:
    attributes:
      - key: service.name
        value: "my-ecommerce-app"
        action: insert
      - key: environment
        value: "production"
        action: insert
exporters:
  otlp:
    endpoint: "YOUR_OBSERVABILITY_PLATFORM_ENDPOINT:4317"
    headers:
      "api-key": "${OTEL_API_KEY}"
service:
  pipelines:
    metrics:
      receivers: [otlp, hostmetrics]
      processors: [batch, resource]
      exporters: [otlp]
    logs:
      receivers: [otlp]
      processors: [batch, resource]
      exporters: [otlp]
    traces:
      receivers: [otlp]
      processors: [batch, resource]
      exporters: [otlp]
This configuration ensures that metrics, logs, and traces are collected, processed with consistent attributes, and sent to your observability backend for AI analysis.
Step 2: Leverage AI-Driven Anomaly Detection
Once your data is flowing, activate the AI-driven anomaly detection features within your observability platform. Most modern platforms offer this out of the box, often with minimal configuration. Instead of defining rigid if X > Y then alert rules, you configure AI models to learn baseline behavior.
Monitor your system for a period (often days or weeks, depending on your platform’s recommendations) to allow the AI to establish a robust understanding of “normal.” Pay attention to the initial alerts generated by the AI. You might need to provide feedback to the model, marking certain anomalies as expected or adjusting sensitivity settings, especially during periods of planned maintenance or deployments. This iterative feedback loop is crucial for training the model effectively for your specific environment.
// Conceptual API request to enable AI anomaly detection for a metric
POST /api/v1/monitors/ai_anomaly_detection
{
  "name": "High Error Rate Anomaly Detection",
  "type": "metric alert",
  "query": "avg:http.server.requests.errors{service:my-ecommerce-app} by {env}",
  "message": "AI detected anomalous error rates in {{env}} environment. Investigate immediately.",
  "options": {
    "evaluation_period": "5m",
    "ai_model_sensitivity": "medium",
    "notify_no_data": false,
    "renotify_interval": 60,
    "tags": ["critical", "ai-driven"]
  }
}
This conceptual example shows how you might define an AI-driven alert for a metric, where the platform’s AI handles the complex thresholding.
Step 3: Implement Predictive Alerting
Move beyond reacting to current state and start acting on future forecasts. Configure alerts based on the predictions generated by your AI models. For instance, if the AI predicts that a disk will reach 90% capacity in the next 4 hours, trigger an alert to provision more storage or clean up old files before a capacity issue causes an outage.
This requires shifting your mindset from “alert on failure” to “alert on predicted failure.” Work with your team to define appropriate thresholds for these predictive alerts. A predictive alert should provide enough lead time for your team to intervene gracefully.
Step 4: Automate Incident Triage and Root Cause Analysis
Utilize AI’s ability to correlate disparate signals to streamline incident response. When an anomaly is detected, your observability platform should automatically link related metrics, logs, and traces. Some advanced platforms can even generate a probable cause summary or suggest runbook actions based on historical incident data.
Integrate these AI-generated insights into your existing incident management workflows. For example, populate your incident tickets with the AI’s suggested root cause and affected services. This empowers your on-call engineers to jump directly to the most relevant information, drastically cutting down mean time to resolution (MTTR).
Common Pitfalls
While the promise of AI in observability is immense, avoiding certain pitfalls is key to a successful implementation.
First, garbage in, garbage out remains a fundamental truth. If your telemetry data is incomplete, inconsistent, or lacks proper context, even the most sophisticated AI models will struggle to produce meaningful insights. Prioritize data quality, consistent naming conventions, and comprehensive instrumentation across your entire stack.
Second, be wary of alert fatigue from misconfigured AI. An overly sensitive AI model can generate an endless stream of “anomalies” that are not truly indicative of problems. This can quickly erode trust in the system and lead engineers to ignore important alerts. It’s crucial to continuously fine-tune your AI models, providing feedback on false positives and adjusting sensitivity until the alerts are genuinely actionable.
Finally, resist the urge to treat AI as a black box solution. While AI can automate much of the analysis, you still need human oversight and expertise. Understand the limitations of your models, and if possible, use platforms that offer some level of explainability for their AI-driven insights. AI should augment, not replace, the critical thinking and experience of your engineering team.
Taking It Further
The journey into AI-powered observability doesn’t end with initial implementation; it’s an ongoing evolution. Consider exploring specialized AIOps platforms that deeply integrate AI and automation across all aspects of IT operations, moving towards truly self-healing systems. These platforms can automate not just detection and analysis, but also remediation steps for known issues.
Beyond reactive fixes, combine predictive monitoring with practices like chaos engineering. By intentionally introducing controlled failures, you can test your AI models’ ability to detect and predict issues in real-world scenarios, validating their effectiveness and refining their accuracy. This synergistic approach ensures your systems are resilient and your AI is robust. Look into applying machine learning to your log data for advanced log anomaly detection, going beyond simple keyword searches to identify subtle, evolving patterns in unstructured text. The goal is to continuously refine your understanding of system behavior and proactively build more robust, intelligent infrastructure.
Wrapping Up
The era of reactive firefighting in software operations is drawing to a close. As systems grow in complexity and data volumes explode, traditional observability methods are simply no longer sufficient. By embracing AI in observability, you’re making a fundamental shift from merely monitoring to actively predicting and preventing issues. This transformation not only reduces incident stress and downtime but also empowers your teams to focus on innovation rather than constant crisis management. Start by consolidating your data, then leverage intelligent anomaly detection and predictive alerting, and finally, integrate automated root cause analysis. The future of operations is proactive, and AI is the engine driving this essential evolution.