Introduction
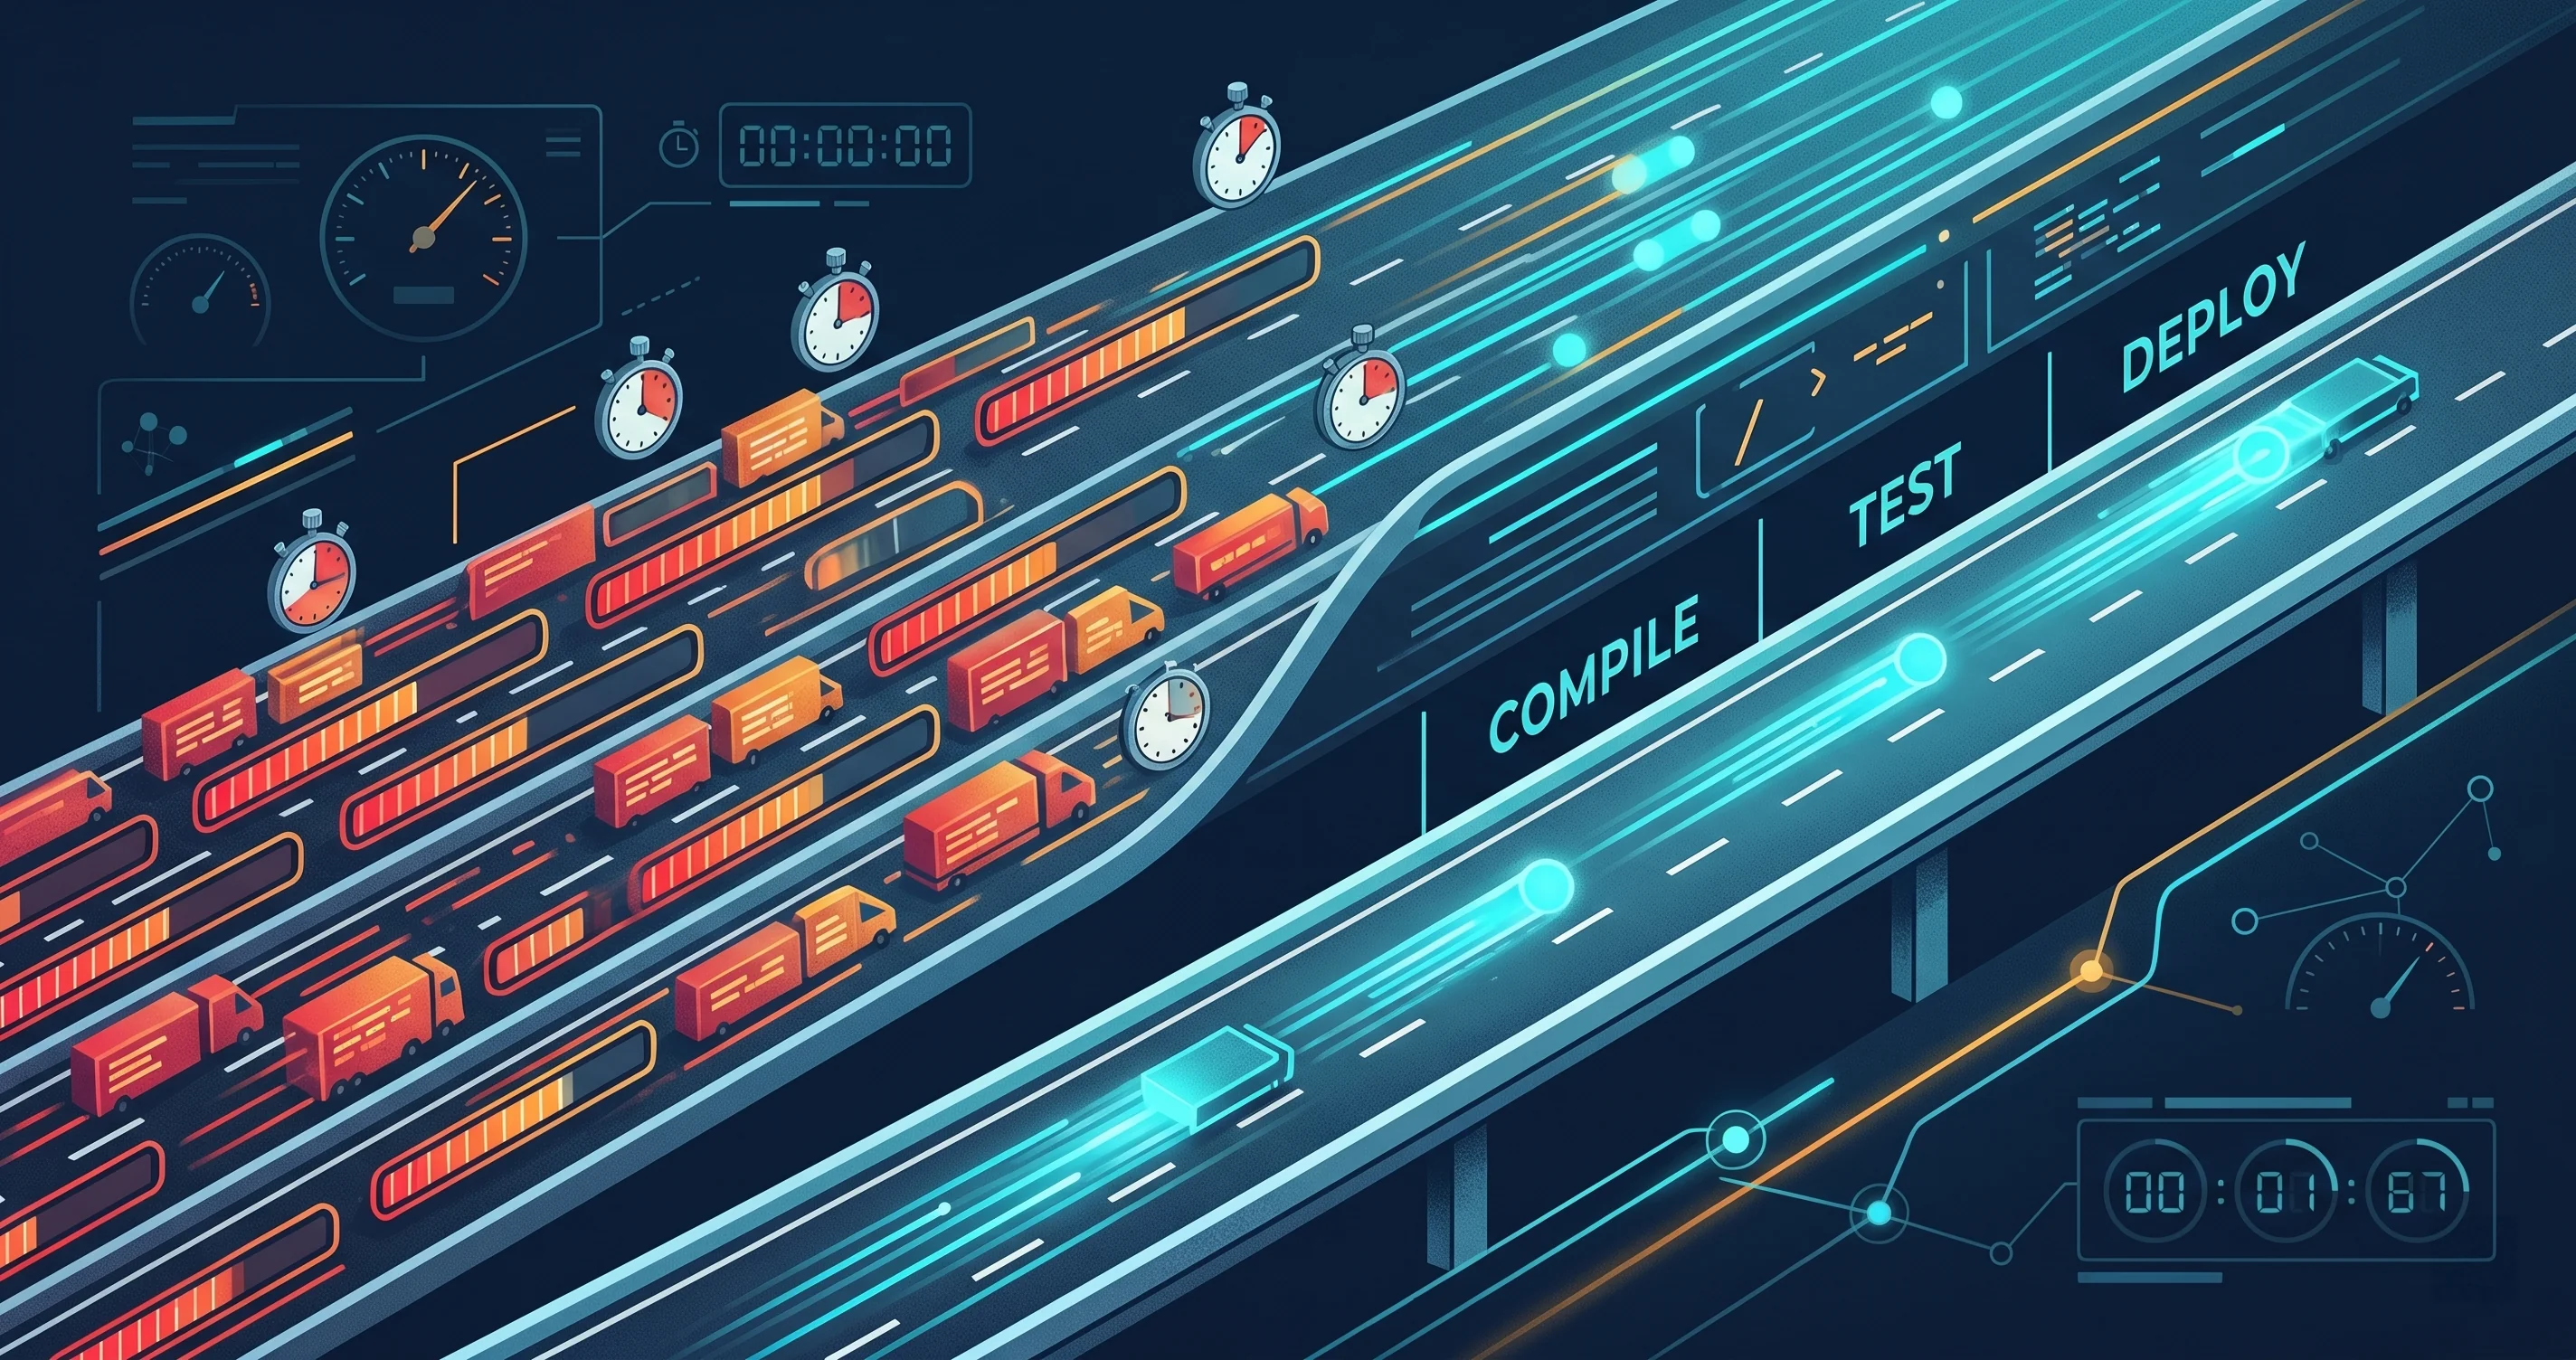
You’ve been there. Staring at the CI/CD dashboard, watching the seemingly endless “pending” or “running” statuses, while your code waits in line. You’ve heard the advice: “Just add more agents.” Or “Increase the parallelism settings.” You tried it, perhaps even saw a temporary bump, but soon enough, the queues were back, the builds were sluggish, and the developer feedback loop remained frustratingly slow. It feels like you’re caught in a traffic jam, even with more lanes open.
This isn’t just a minor inconvenience. Slow CI/CD pipelines lead to context switching, delayed releases, and a constant drain on your team’s productivity and morale. You know there has to be a better way to get your changes from commit to production with speed and confidence.
In this post, we’re going to uncover a common misconception, often tied to a misinterpretation of Little’s Law, that keeps many pipelines slow. We’ll then walk through actionable strategies to genuinely accelerate your CI/CD, giving you back precious development time and speeding up your software delivery.
The Problem Worth Solving
Imagine you’ve just pushed a critical bug fix or a new feature. You kick off the CI/CD pipeline, expecting rapid feedback. Instead, your build sits in a queue, waiting for an available agent. When it finally starts, it grinds through a series of steps that feel like they take forever: compiling, running hundreds of tests, building Docker images, and perhaps deploying to a staging environment. Meanwhile, you’re context-switching, checking Slack, or grabbing another coffee.
This cycle repeats. Your team might increase the number of build agents or raise the maximum concurrent jobs, hoping to clear the backlog. For a brief period, things might look better. But soon, the queues return, or worse, the individual build times start creeping up. You might notice agents contending for shared resources, network drives getting saturated, or external service calls timing out. The supposed solution of “more parallelism” has merely shifted the bottleneck, not eliminated it.
This pervasive slowness isn’t just an engineering headache; it directly impacts your business. Longer lead times for changes mean slower innovation, delayed customer value, and a reduced capacity to respond to market demands or critical issues. The problem is clear: your pipelines are slow, and the intuitive fixes aren’t delivering the sustained improvement you need.
The Misapplication of Little’s Law
At the heart of many CI/CD performance issues lies a subtle misinterpretation of Little’s Law. This elegant theorem, first formulated by John D.C. Little, states that for any stable system over a long period:
L = λW
Where:
Lis the average number of items in the system (Work In Progress, or WIP).λis the average arrival rate of items into the system (Throughput).Wis the average time an item spends in the system (Cycle Time).
In the context of CI/CD, you might think of L as the number of concurrent builds, λ as the rate at which builds complete, and W as the total time a single commit takes from push to completion.
The common fallacy arises when we assume that increasing L (more concurrent builds or WIP) will automatically increase λ (throughput) without impacting W (cycle time). The reasoning often goes: “If we can run more builds at once, we’ll process more changes per hour.”
However, this only holds true if W remains constant, which is rarely the case in complex CI/CD systems. When you simply throw more concurrent jobs at your existing infrastructure, several things can happen:
- Resource Contention: Multiple jobs might compete for limited CPU, memory, disk I/O, or network bandwidth on shared build agents or infrastructure. This slows down each individual job, increasing its
W. - External Service Bottlenecks: Your builds might rely on external services like package registries, database instances, or artifact repositories. If these services become overloaded by too many simultaneous requests, they slow down for everyone, again increasing
W. - Queueing Shifts: While you might reduce the initial waiting for an agent queue, you often create new queues within the pipeline steps, as processes wait for shared resources or slower upstream steps. This still adds to the total
Wfor each item.
The core insight from Little’s Law for CI/CD isn’t to maximize WIP. Instead, it’s to focus on reducing the average time an item spends in the system (W), the cycle time for a single build. By making individual builds faster and more efficient, you naturally increase your system’s throughput (λ) without overwhelming it, even if you keep your WIP (L) relatively low. The real goal is to reduce the time from commit to completion for any given change, thereby empowering developers and accelerating value delivery.
How to Apply This: Optimizing Your CI/CD Cycle Time
The true path to faster CI/CD pipelines involves systematically reducing the cycle time (W) for each unit of work (typically, a single commit or pull request). This is about making each build lean and efficient, not just running more slow builds concurrently.
Step 1: Visualize and Measure Your Cycle Time
You cannot optimize what you do not measure. Start by gaining clear visibility into your pipeline’s performance. Focus on these key metrics for a single commit:
- Queue Time: The time from commit until the build actually starts.
- Build Execution Time: The total time the pipeline spends actively running steps.
- Deployment Time (if applicable): The time from successful build to deployment to a specific environment.
Many CI/CD platforms offer built-in analytics or integrations with tools like Grafana or DataDog to capture this data. Look for ways to visualize these times for individual jobs and overall pipelines.
Step 2: Identify Bottlenecks Within a Single Pipeline Run
Once you have data, dive into a typical, slow pipeline run. Analyze the duration of each individual stage and step. Is compilation taking too long? Are tests consuming the majority of the time? Is Docker image building the culprit?
For example, in a GitHub Actions workflow, you might see something like this:
jobs:
  build:
    runs-on: ubuntu-latest
    steps:
      - name: Checkout code
        uses: actions/checkout@v4

      - name: Set up Node.js
        uses: actions/setup-node@v4
        with:
          node-version: "20"

      - name: Cache Node modules
        id: cache-npm
        uses: actions/cache@v4
        with:
          path: ~/.npm
          key: ${{ runner.os }}-node-${{ hashFiles('**/package-lock.json') }}
          restore-keys: |
            ${{ runner.os }}-node-

      - name: Install dependencies
        run: npm ci

      - name: Run unit tests
        run: npm test -- --coverage

      - name: Build application
        run: npm run build
By examining the execution logs, you can pinpoint exactly which run: command or uses: action is consuming the most time.
Step 3: Optimize Individual Pipeline Steps
This is where the real work happens. Focus on reducing the duration of the identified bottlenecks.
Caching Dependencies
One of the most effective ways to speed up builds is by caching dependencies. Tools like npm, Yarn, Maven, Gradle, and Docker all generate artifacts that can be reused across builds.
# Example: Caching Maven dependencies in GitLab CI
cache:
  paths:
    - .m2/repository

build_job:
  image: maven:3.8.5-openjdk-17
  script:
    - mvn compile
Ensure your caching strategy is robust, invalidated correctly when dependencies change, and not over-cached (leading to stale builds).
Parallelizing Within a Stage
Instead of running more entire pipelines concurrently, look for opportunities to parallelize within a single pipeline’s stages. For instance, splitting a large test suite into smaller, independent chunks that can run in parallel on multiple agents.
# Example: Parallelizing Jest tests
jobs:
  test:
    strategy:
      matrix:
        shard: [1, 2, 3] # Run tests in 3 parallel shards
    steps:
      - name: Checkout code
        uses: actions/checkout@v4
      - name: Install dependencies
        run: npm ci
      - name: Run tests (shard ${{ matrix.shard }})
        run: npm test --shard=${{ matrix.shard }} --total-shards=3
This reduces the W for the ‘test’ step significantly.
Optimizing Build Artifacts and Images
Are your Docker images excessively large? Use multi-stage builds (Dockerfile) to keep the final image minimal. Optimize your build process to generate only necessary artifacts. Avoid rebuilding common base images if they haven’t changed.
# Example: Multi-stage Docker build
FROM node:20-alpine AS builder
WORKDIR /app
COPY package*.json ./
RUN npm ci
COPY . .
RUN npm run build

FROM nginx:stable-alpine
COPY --from=builder /app/dist /usr/share/nginx/html
EXPOSE 80
CMD ["nginx", "-g", "daemon off;"]
Selective Testing
For large codebases, running all tests for every commit might be overkill, especially for trivial changes. Explore tools that can identify and run only the tests relevant to the changed code. This requires careful implementation to avoid introducing regressions.
Step 4: Right-Sizing Resources and Agents
Ensure your build agents have sufficient CPU, memory, and disk I/O for their workload. If you’ve optimized individual steps but agents are still struggling, they might be underpowered. Conversely, if agents are sitting idle, you might have too many or they are misconfigured to pick up jobs. Monitor agent utilization closely. Shared build infrastructure can also become a bottleneck; consider dedicated agents for particularly resource-intensive jobs.
Step 5: Decouple and Isolate Dependencies
Reduce the reliance on external services during your build and test phases. Use in-memory databases, mock external APIs, or pre-provision test data rather than fetching it in real-time. Each external call adds potential latency and a point of failure to your pipeline’s cycle time.
Common Pitfalls
While pursuing faster pipelines, be aware of these common traps:
- Blind Parallelism: Merely increasing the number of concurrent jobs without addressing the underlying slowness of each job. This often exacerbates resource contention.
- Ignoring Queue Time: Focusing solely on execution time. If builds spend 30 minutes in a queue before a 5-minute execution, your effective cycle time is still 35 minutes. Queue time is wasted time for developers.
- Ineffective Caching: Implementing caches that are too aggressive (leading to stale builds) or not aggressive enough (missing opportunities for reuse). Caches must be thoughtfully designed and regularly reviewed.
- Over-reliance on Monolithic Test Suites: Running every test for every minor change. This increases
Wunnecessarily. Prioritize fast unit tests and reserve slower integration tests for less frequent, targeted runs or later stages. - Lack of Observability: Trying to optimize without clear, granular metrics. Gut feelings are not substitutes for data when identifying bottlenecks.
Taking It Further
Optimizing your CI/CD pipelines is a continuous journey. Once you’ve tackled the most obvious bottlenecks, consider integrating DORA metrics (Deployment Frequency, Lead Time for Changes, Mean Time to Restore, Change Failure Rate) into your performance tracking. Your efforts to reduce cycle time directly improve “Lead Time for Changes,” which is a key indicator of development team effectiveness.
Explore tools for value stream mapping to visualize the entire flow of work from idea to production, identifying non-value-add delays beyond just the CI/CD pipeline. Techniques like distributed tracing for pipelines can offer even deeper insights into the precise timing of internal operations and dependencies. Finally, foster a culture of continuous improvement within your team, regularly reviewing pipeline performance and dedicating time to small, iterative optimizations. Every second saved in your CI/CD translates directly to more productive developer time and faster value delivery.
Wrapping Up
Your CI/CD pipelines are the heartbeat of your software delivery process. If they’re slow, your entire team feels the drag. The common mistake is to misapply Little’s Law, assuming that simply adding more parallel builds will magically increase throughput. As we’ve seen, the real power of Little’s Law in CI/CD lies in understanding that to achieve higher throughput, you must relentlessly focus on reducing the cycle time of each individual change. By systematically measuring, identifying, and optimizing the bottlenecks within your build, test, and deployment steps, you can transform your sluggish pipelines into rapid, reliable feedback loops. Start measuring today, and empower your team to ship faster and with greater confidence.